
Octoverse 2026: ยุคทองของ Agent กับสถิติการ Commit พุ่งทำลายสถิติ

ในช่วง 12 เดือนที่ผ่านมา นักพัฒนาทั่วโลกได้ทำการ Push โค้ดไปยัง GitHub สูงถึง 1.79 หมื่นล้านครั้ง ซึ่งเป็นตัวเลขที่มากกว่ายอดรวมของปี 2024 และ 2025 รวมกันอย่างน่าทึ่ง
เบื้องหลังสถิตินี้สะท้อนถึงพลังของชุมชนนักพัฒนาที่มุ่งแก้ปัญหาจริง เช่น ในเนปาลมีการสร้าง แถลงการณ์อุทกภัยบน GitHub Pages จนพัฒนาเป็น Gati ระบบแจ้งเตือนภัยพิบัติอย่างเป็นทางการ ขณะที่ทีม NASA JPL กำลังพัฒนา ซอฟต์แวร์สำหรับยานอวกาศ และยังมีโปรเจกต์โอเพนซอร์สอย่าง เฟิร์มแวร์ปรับแต่งเครื่องอ่านอีบุ๊ก ที่แสดงให้เห็นว่าความสร้างสรรค์บน GitHub กำลังขยายตัวไปในทุกทิศทาง
การเติบโตแบบก้าวกระโดดนี้เกิดขึ้นพร้อมกับการเปลี่ยนผ่านของเทคโนโลยี โดย Agent ได้กลายเป็นส่วนหนึ่งของเวิร์กโฟลว์หลัก แทนที่จะเป็นเพียงเครื่องมือทดลอง นักพัฒนามีทางเลือกในการใช้โมเดลที่หลากหลายมากขึ้นในหลากหลายอุตสาหกรรม ตั้งแต่การดูแลสุขภาพไปจนถึงเกษตรกรรม
รายงาน Octoverse ในปีนี้มีความสำคัญอย่างยิ่ง โดยมีประเด็นที่โดดเด่นดังนี้:
- AI ขับเคลื่อนการทำงาน: Repository ที่มีการใช้งาน Agent มีการบันทึกการ Commit มากกว่า Repository ทั่วไปถึง 8 เท่า
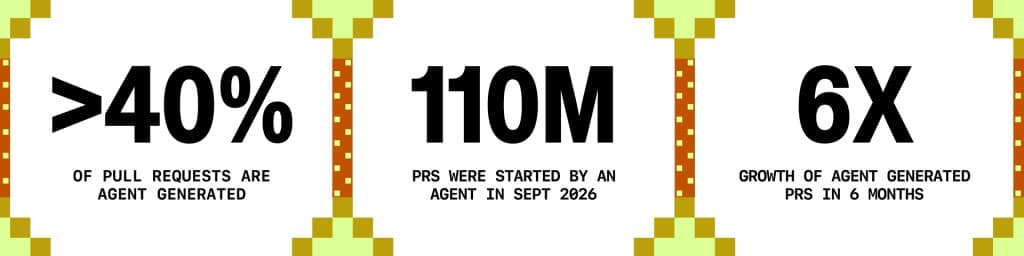
- Agent เริ่มต้นการสร้าง Pull Request: ณ เดือนกันยายน นักพัฒนาสร้าง Pull Request ผ่าน Agent มากกว่า 40% เพิ่มขึ้นอย่างมากจาก 17% ในเดือนมีนาคม โดยเปลี่ยนบทบาทนักพัฒนาไปเน้นการสั่งการและตรวจสอบ (Review) แทน
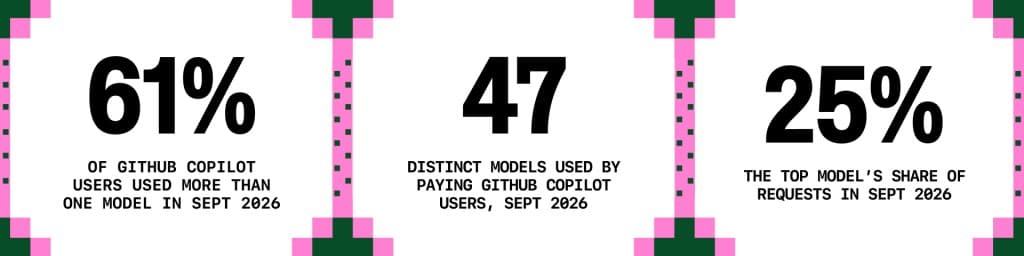
- การเลือกใช้โมเดลที่หลากหลาย: ผู้ใช้ GitHub Copilot กว่า 61% เลือกใช้มากกว่าหนึ่งโมเดล โดยกระจายตามความเหมาะสม ทั้งโมเดลทั่วไป (General Purpose), โมเดลเน้นการวางแผน (Deep Reasoning and Planning) และโมเดลที่เน้นความเร็ว (Fast and Lightweight)
- ขยายตัวสู่ทุกภาคธุรกิจ: อุตสาหกรรมดั้งเดิมอย่างการทำเหมืองแร่ การก่อสร้าง และเกษตรกรรม มีการสร้าง Repository เพิ่มขึ้นหลายเท่าตัวนับตั้งแต่ปี 2022
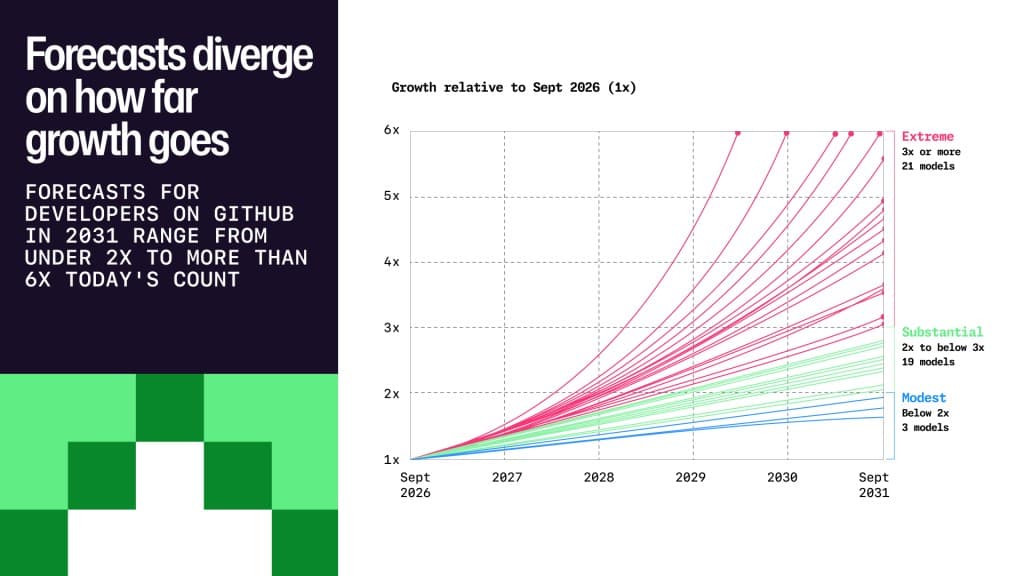
ความก้าวหน้าของโมเดล AI ส่งผลให้การเติบโตของจำนวนนักพัฒนาเร็วกว่าที่เคยคาดการณ์ไว้ โดยหลายประเทศเข้าใกล้เป้าหมายจำนวนนักพัฒนาในปี 2030 เร็วกว่ากำหนดถึงหนึ่งในห้าของระยะทางภายในเวลาเพียงปีเดียว จนทำให้โมเดลพยากรณ์ในปัจจุบันไม่สามารถระบุทิศทางที่แน่นอนได้เนื่องจากการเติบโตที่รุนแรงเกินคาด
ปีที่นักพัฒนากำหนดจังหวะความเร็วใหม่
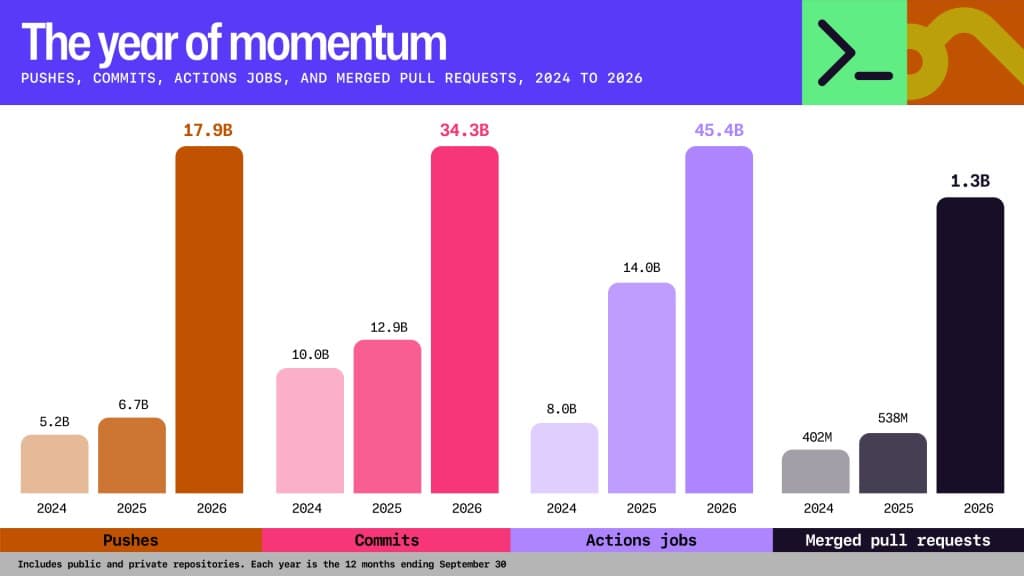
ปี 2026 คือปีแห่งแรงขับเคลื่อน (Momentum) อย่างแท้จริง การ Commit ในทุกประเภท Repository พุ่งสูงถึง 3.43 หมื่นล้านครั้ง ซึ่งมากกว่าเมื่อสองปีก่อนถึงสามเท่า ขณะที่ Merged Pull Request เพิ่มขึ้นเป็น 1.3 พันล้านครั้ง หรือเฉลี่ย 3.5 ล้านครั้งต่อวัน
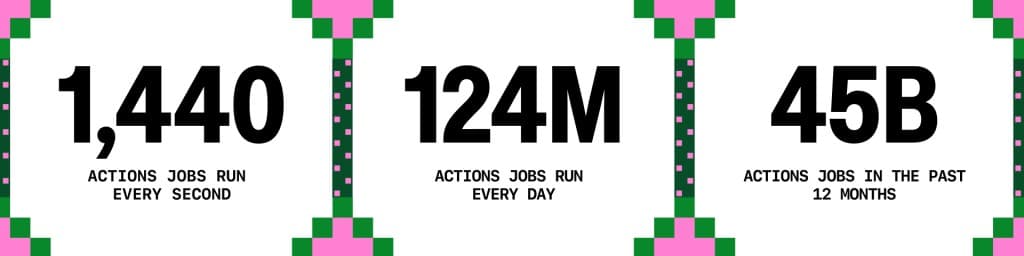
การใช้ระบบอัตโนมัติก็เติบโตอย่างมีนัยสำคัญ GitHub Actions รันงานเฉลี่ย 1,440 ครั้งต่อวินาที หรือ 124 ล้านครั้งต่อวัน ซึ่งมากกว่าปีที่แล้วสามเท่า นอกจากนี้ยังมีการ Merge Pull Request จาก Dependabot กว่า 30 ล้านครั้ง เพื่อรักษาความปลอดภัยของซอฟต์แวร์ให้ทันสมัยอยู่เสมอ
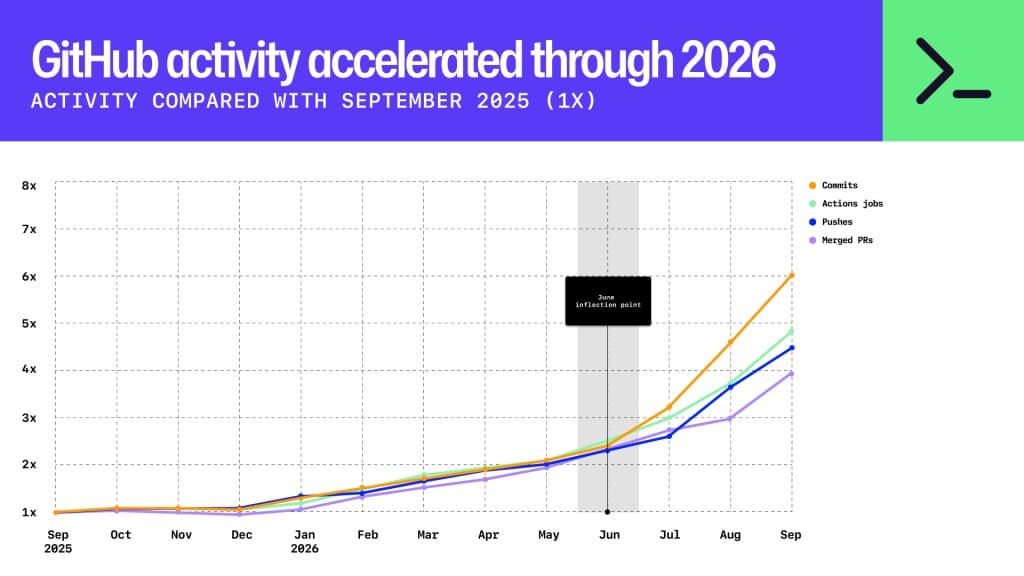
จุดเปลี่ยนสำคัญเกิดขึ้นในช่วงเดือนมิถุนายน เมื่อกิจกรรมบน GitHub พุ่งทะยานขึ้นอย่างรวดเร็ว เนื่องจาก Agent พัฒนาจากการทำงานแบบเซสชันเดียวไปสู่เครื่องมือที่ทำงานได้ถาวร (Persistent) และสามารถทำงานร่วมกับระบบคลาวด์ได้อย่างกว้างขวาง ทำให้สามารถติดตามความคืบหน้าและจัดการงานที่ซับซ้อนได้ข้ามวัน
ในฝั่งโอเพนซอร์ส การมีส่วนร่วมสาธารณะ (Public Contributions) สูงถึง 2.5 พันล้านครั้งในปี 2026 เพิ่มขึ้นจากปีที่แล้วกว่าเท่าตัว โดยมีนักพัฒนาอย่าง @kinlane ที่ใช้เวิร์กโฟลว์แบบ Agentic ในการจัดการข้อมูล API หรือ @kim-em ที่ดูแลห้องสมุดคณิตศาสตร์ และ @andig ผู้พัฒนาโครงการ evcc สำหรับจัดการพลังงานรถยนต์ไฟฟ้า
นักพัฒนากำลังร่วมสร้างจากสถานที่ที่หลากหลายขึ้น
ปัจจุบัน GitHub ให้บริการนักพัฒนามากกว่า 225 ล้านคนทั่วโลก โดยสหรัฐอเมริกา (38.3 ล้านคน) และอินเดีย (32 ล้านคน) ยังคงเป็นสองอันดับแรกที่มีการเติบโตสูงสุด ส่วนบราซิลตามมาเป็นอันดับสามด้วยจำนวนนักพัฒนาที่เพิ่มขึ้นถึง 3.28 ล้านคนในปีนี้
| ประเทศ | จำนวนนักพัฒนาทั้งหมดบน GitHub ณ ก.ย. 2026 |
|---|---|
| สหรัฐอเมริกา | 38.3 M |
| อินเดีย | 32.0 M |
| จีน | 12.4 M |
| บราซิล | 10.2 M |
| ญี่ปุ่น | 7.15 M |
| สหราชอาณาจักร | 6.47 M |
| อินโดนีเซีย | 6.34 M |
| เยอรมนี | 6.30 M |
| รัสเซีย | 5.07 M |
| ฝรั่งเศส | 4.75 M |
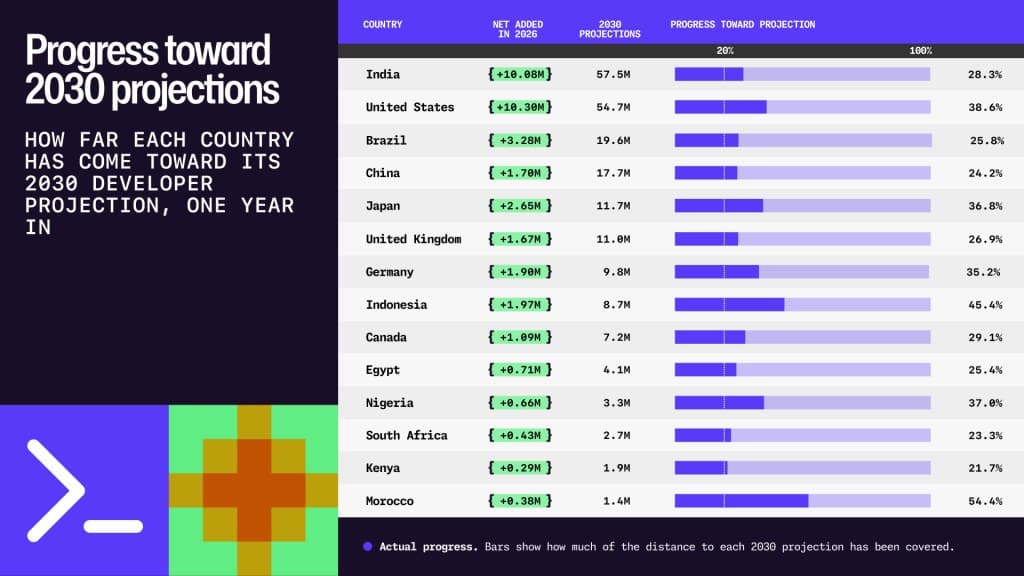
แรงขับเคลื่อนนี้กระจายไปทั่วทุกภูมิภาค โดยมีปัจจัยสนับสนุนที่แตกต่างกัน เช่น อเมริกาเน้นไปที่ Fintech และ AI, ภูมิภาค EMEA เติบโตจากการใช้ AI ในภาคการผลิตและสตาร์ทอัพในแอฟริกา ส่วน APAC ได้รับอิทธิพลจากการลงทุนของภาครัฐในโครงสร้างพื้นฐาน AI
อนาคตกำลังถูกสร้างขึ้นในทุกที่
ปีนี้ AI ได้เข้าถึงทุกอุตสาหกรรมอย่างแท้จริง จากการวิเคราะห์ข้อมูลพบว่า ภาคบริการบริหารจัดการ, การทำเหมืองแร่, และการดูแลสุขภาพ มี Repository ที่กล่าวถึง AI มากกว่า 40% ขณะที่ภาคการก่อสร้างโดดเด่นด้วยการใช้ Agent เปิด Pull Request สูงถึง 9% ซึ่งเป็นสัดส่วนที่สูงที่สุด
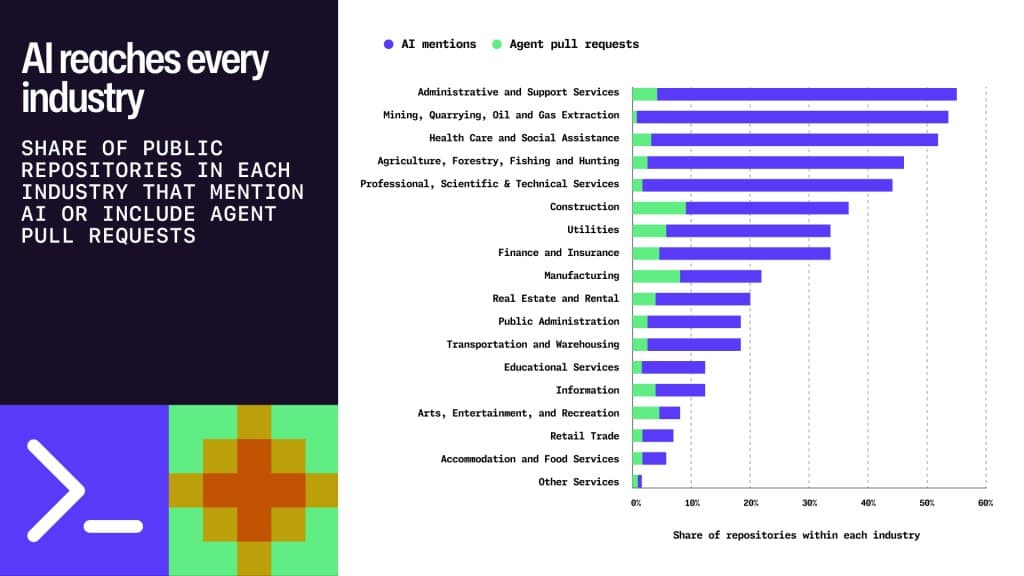
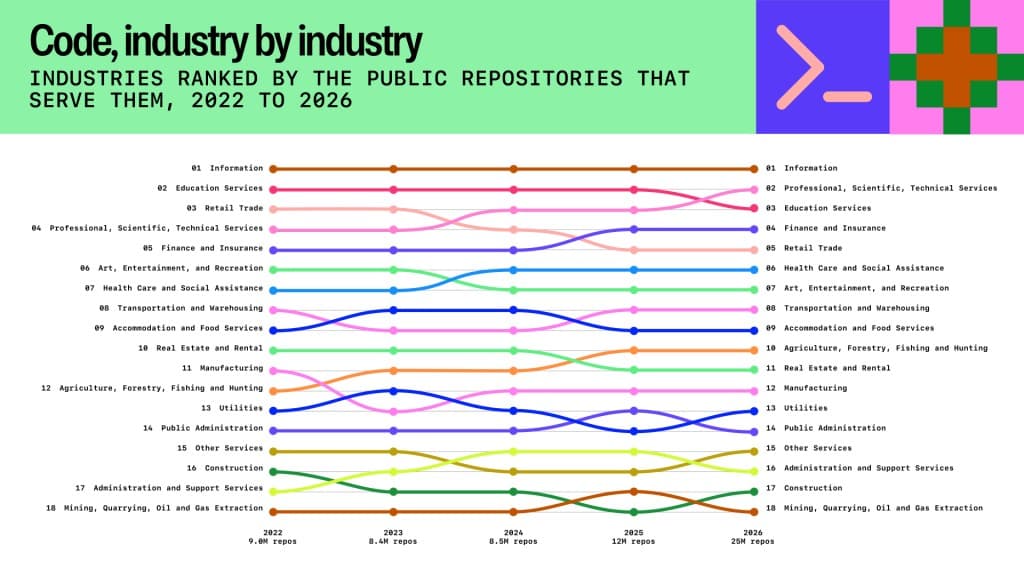
ตัวอย่างโครงการที่น่าสนใจ ได้แก่ การใช้ AI ช่วยนักวิจัยวิเคราะห์เนื้อเยื่อ wsidata, ระบบจัดการพลังงานอุตสาหกรรม OpenPinch และแม้แต่พอร์ทัลตรวจสอบสัญญาจ้างภาครัฐของบัลแกเรียอย่าง sigma ซึ่งสะท้อนว่าผู้เชี่ยวชาญในแต่ละสาขากำลังใช้ AI เพื่อแก้ปัญหาเฉพาะทางของตนเอง
นักพัฒนากำลังปรับโฉมเวิร์กโฟลว์ของตนเอง
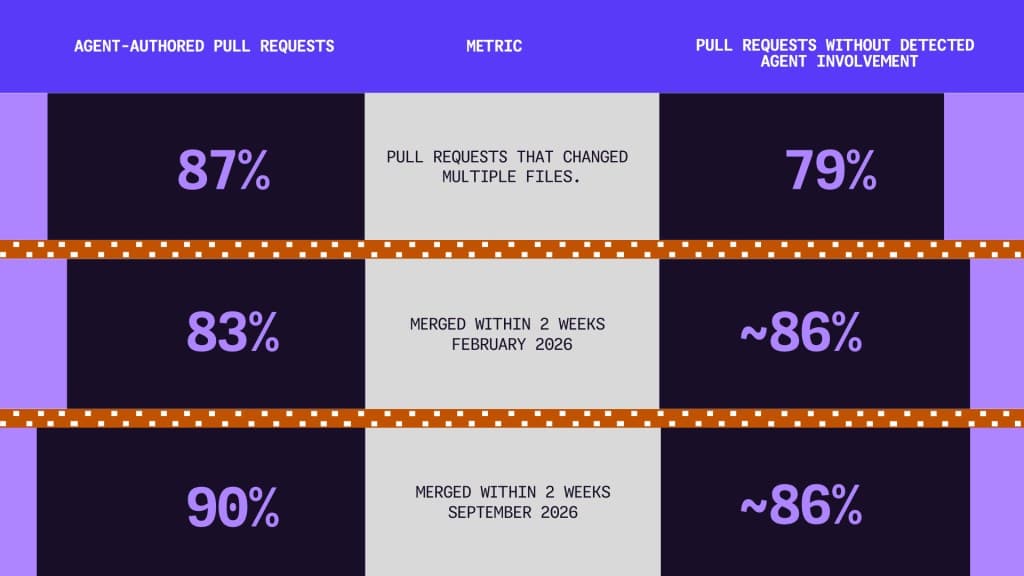
สถิติที่น่าสนใจคือภายในเดือนกันยายน 2026 มี Pull Request ถึง 110 ล้านครั้งที่เริ่มต้นโดย Agent ซึ่งเพิ่มขึ้นจากเดือนมีนาคมถึง 6 เท่า และ Pull Request เหล่านี้ยังมักจะได้รับการ Merge รวดเร็วกว่า โดยมีอัตราการ Merge สำเร็จภายในสองสัปดาห์สูงถึง 90%
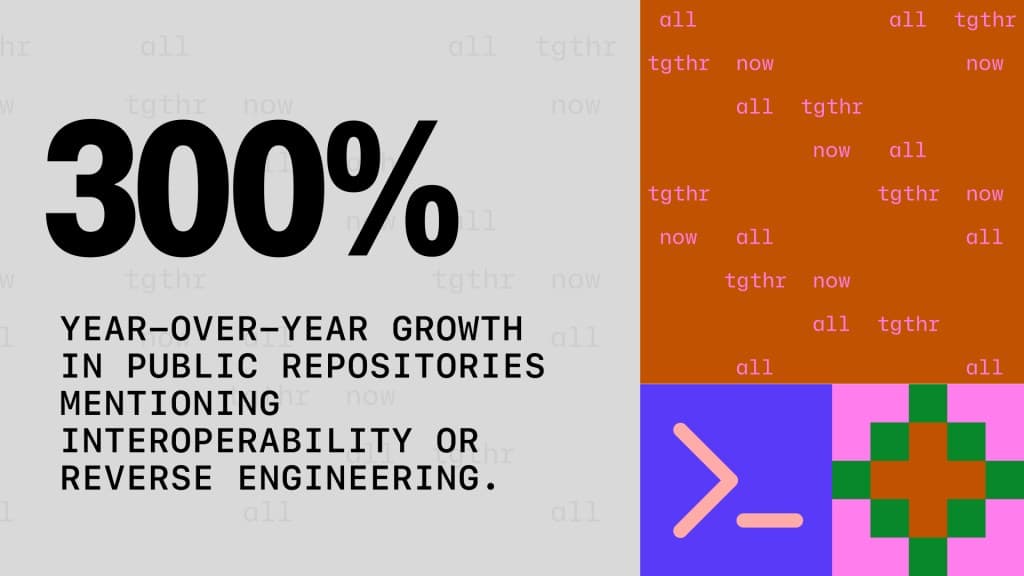
นอกจากนี้ ความสนใจในเรื่อง Social Engineering และการทำงานร่วมกัน (Interoperability) พุ่งสูงขึ้นกว่า 300% ขณะที่เครื่องมือตรวจสอบโค้ดอย่าง Stacked pull requests และการสแกนความลับด้วยระบบป้องกันการ Push ก็ได้รับความนิยมเพิ่มขึ้นหลายเท่าตัว
การเลือกโมเดลเคลื่อนที่ด้วยความเร็วของนักพัฒนา
นักพัฒนาไม่ได้ยึดติดกับโมเดลเดียว โดยมีการเลือกใช้โมเดลที่แตกต่างกันถึง 47 โมเดลผ่าน GitHub Copilot และส่วนใหญ่มีการเปลี่ยนโมเดลระหว่างการทำงานตามความเหมาะสมของงานนั้นๆ
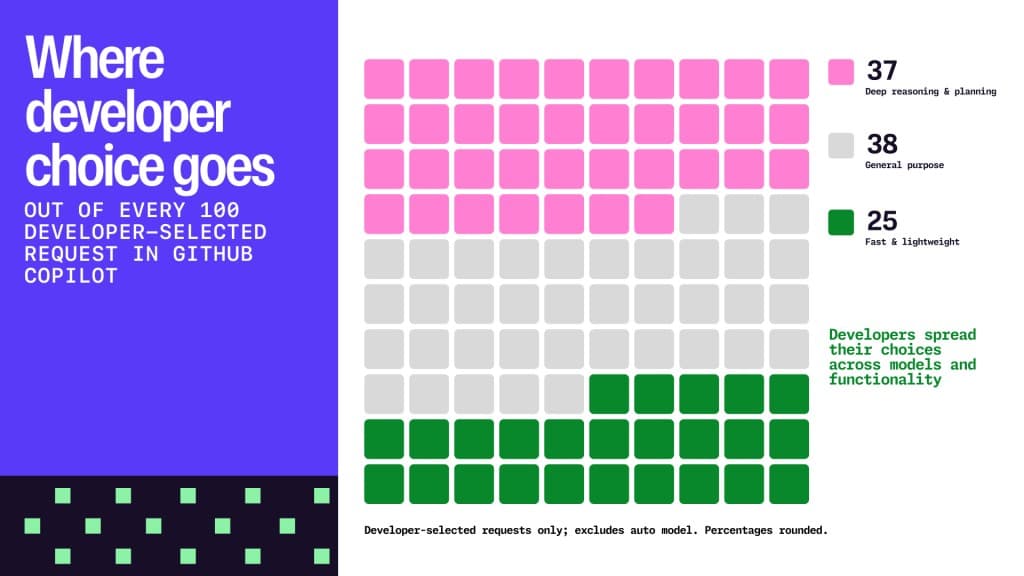
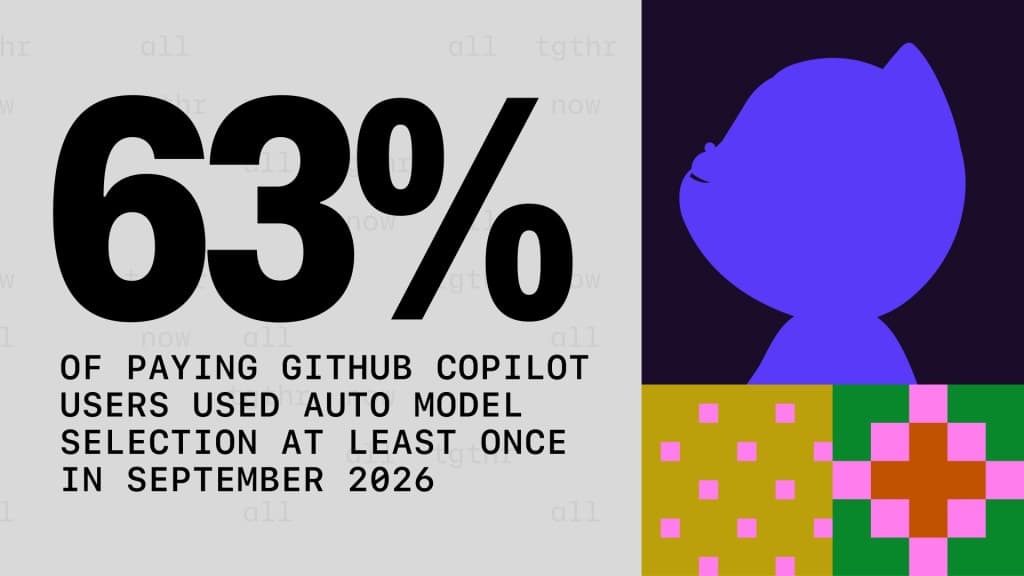
ทางด้านระบบ GitHub Copilot Fusion (เดิมชื่อ Project HydraFusion) ได้เข้ามาช่วยจัดการเลือกโมเดลให้อัตโนมัติ (auto model selection) โดยนักพัฒนากว่า 63% เริ่มหันมาใช้ฟีเจอร์นี้เพื่อให้ระบบเลือกโมเดลที่คุ้มค่าและมีประสิทธิภาพที่สุดให้โดยตรง
การเลือกภาษาได้รับอิทธิพลใหม่ ๆ
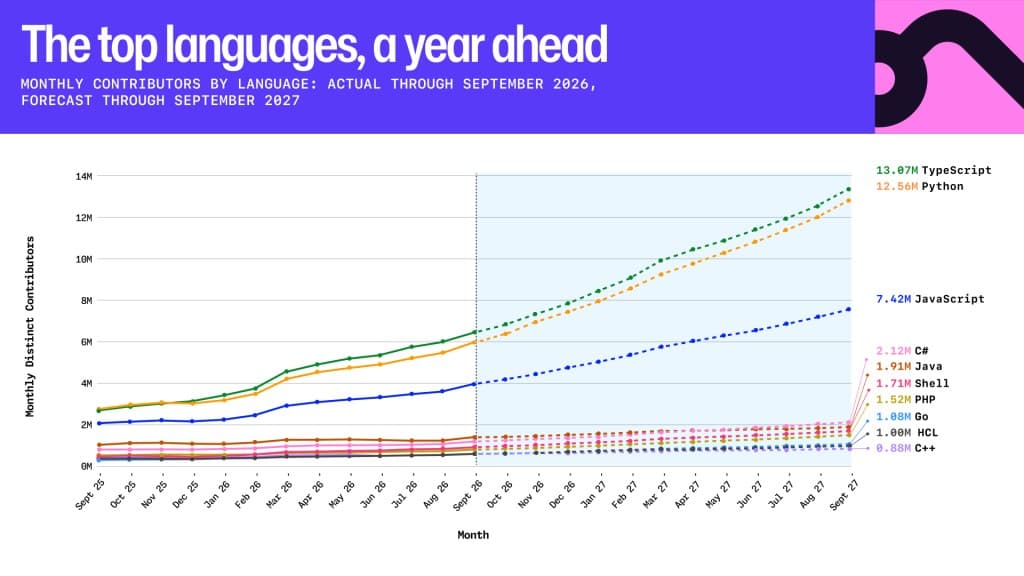
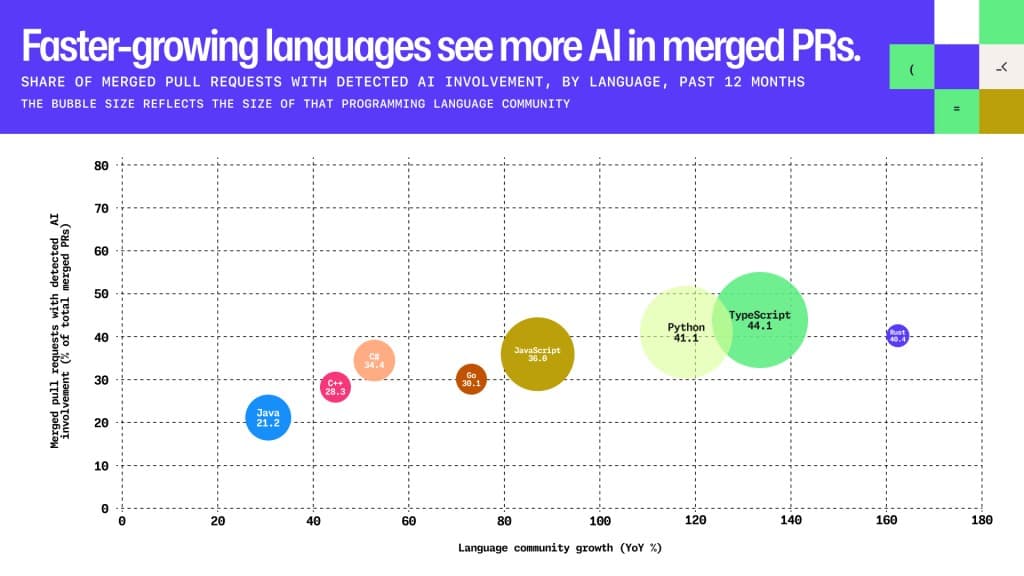
TypeScript ยังคงครองอันดับหนึ่งตามด้วย Python และ JavaScript อย่างไรก็ตาม ภาษาที่เติบโตเร็วที่สุดคือ Rust ที่มียอดผู้ใช้เพิ่มขึ้นเท่าตัวในปีเดียว
สิ่งที่น่าสนใจคือ ความสัมพันธ์ระหว่างภาษาที่มีการใช้ AI สูงสุด ซึ่งได้แก่ TypeScript, Python และ Rust โดยพบว่ามีส่วนเกี่ยวข้องกับ AI ใน Pull Request ถึง 40-44%
สิ่งที่ไม่เปลี่ยนแปลง
แม้อุตสาหกรรมจะเปลี่ยนไป แต่อีโมจิจรวด 🚀 ยังคงเป็นสัญลักษณ์ยอดนิยมอันดับหนึ่งในหมู่ผู้ใช้ GitHub สะท้อนถึงความมุ่งมั่นที่จะพัฒนาอย่างรวดเร็ว แม้ Agent จะเข้ามาช่วยผ่อนแรง แต่การตัดสินใจหลักและนวัตกรรมใหม่ๆ ยังคงมาจากความคิดสร้างสรรค์ของมนุษย์ เช่น การประเมินความเสี่ยงแผ่นดินไหว หรือ การติดตามนโยบายความเป็นส่วนตัว ที่ยังต้องอาศัยวิจารณญาณของผู้สร้างเสมอ
ความคิดเห็น (0)
เข้าสู่ระบบเพื่อร่วมแสดงความเห็น
สมัครสมาชิกมาเป็นคนแรกที่แสดงความเห็นกันเลยโบร