
ทำความรู้จัก GraphEval: กรอบการทำงานตรวจจับภาวะหลอนใน LLM ด้วยกราฟความรู้
บทนำ
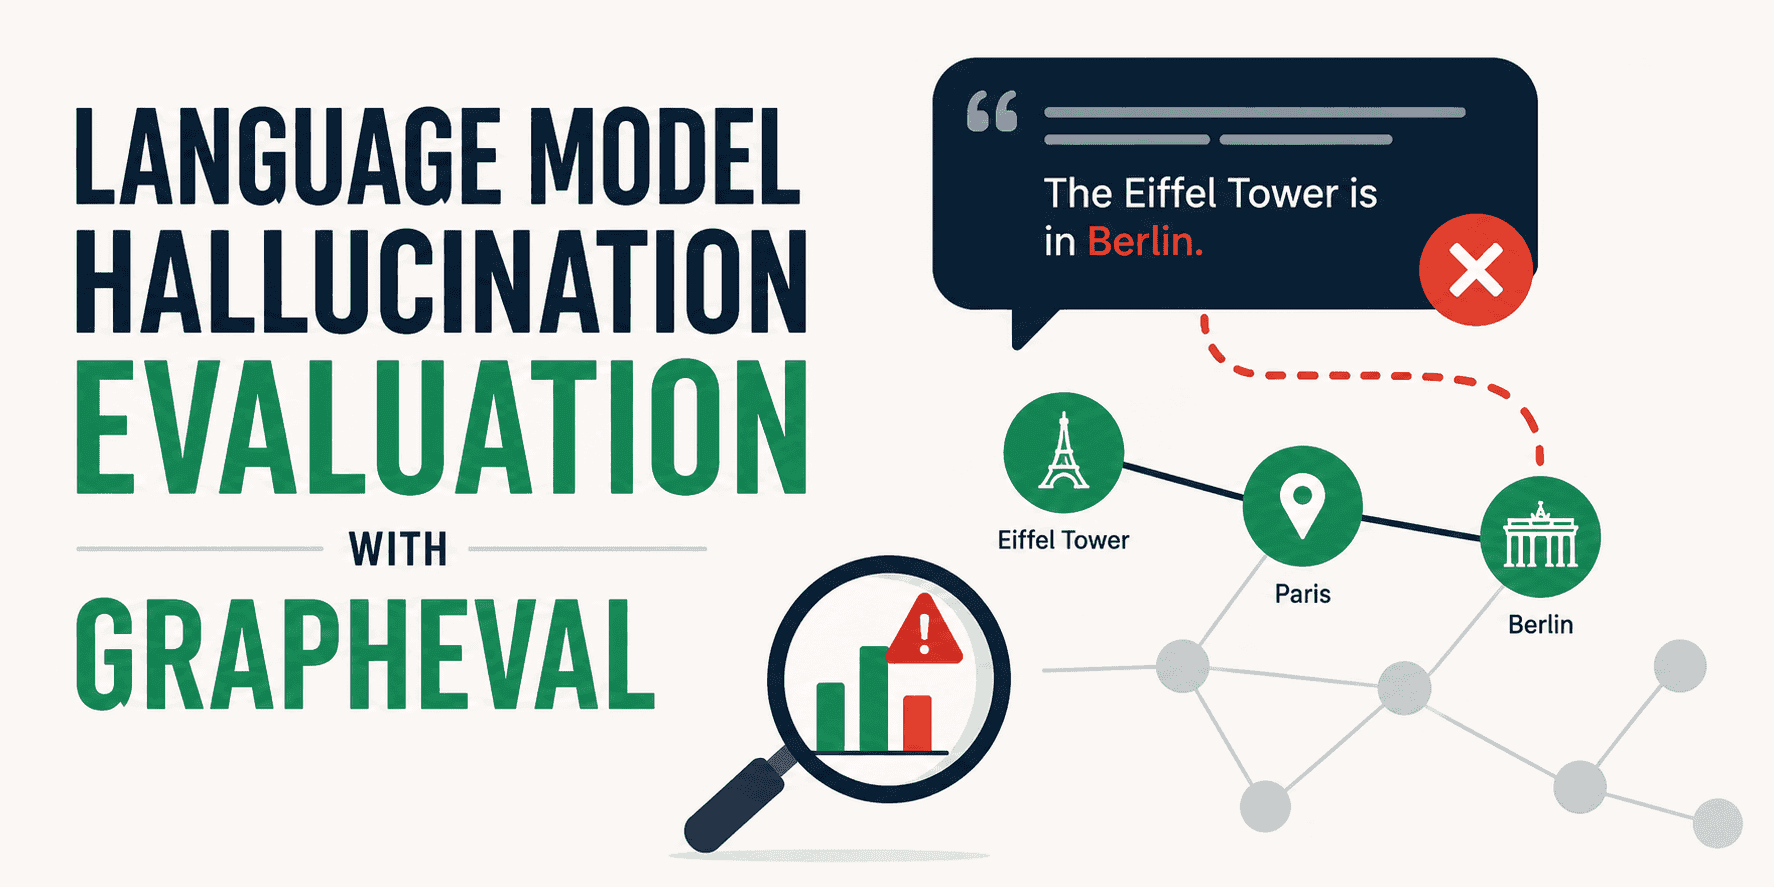
ภาวะหลอน (Hallucinations) เป็นหนึ่งในปัญหาที่พบได้บ่อยที่สุดใน โมเดลภาษาขนาดใหญ่ (LLMs) เมื่อสร้างคำตอบ ปัญหานี้เกิดขึ้นเมื่อโมเดลสร้างข้อมูลที่ไม่ถูกต้องตามข้อเท็จจริง ไม่สมเหตุสมผล หรือกุเรื่องขึ้นมาเองโดยไม่มีมูลความจริง ซึ่งมักมีสาเหตุมาจากโมเดลขาดความรู้ในเรื่องนั้นๆ
แม้ในช่วงไม่กี่ปีที่ผ่านมาจะมีโซลูชันมากมายเพื่อจัดการกับภาวะหลอน แต่กรอบการประเมินทางระเบียบวิธีเพื่อวินิจฉัยปัญหาเหล่านี้กลับได้รับความสนใจน้อยกว่า งานวิจัยล่าสุด โดยนักวิจัยจาก Amazon จึงเสนอให้ใช้กราฟความรู้ (Knowledge Graphs) เป็นเครื่องมือวิเคราะห์และตรวจจับภาวะหลอนใน LLM ภายใต้กรอบการทำงานที่ชื่อว่า GraphEval
บทความนี้จะอธิบายองค์ประกอบเชิงแนวคิดของ GraphEval ผ่านการทดลองด้วยโค้ดจำลองขนาดเล็ก เพื่อให้เห็นภาพการนำไปใช้งานจริงที่เข้าใจง่ายและสามารถทดลองทำตามได้ทันที
สรุปสาระสำคัญของ GraphEval
GraphEval ใช้ประโยชน์จากกราฟความรู้เพื่อระบุและส่งสัญญาณเมื่อพบภาวะหลอนในข้อมูลที่สร้างโดย LLM ซึ่งแตกต่างจากตัวชี้วัดทั่วไปที่ให้เพียงคะแนนรวมความแม่นยำ โดย GraphEval จะเน้นความสามารถในการอธิบาย (Explainability) เพื่อให้ทราบว่าภาวะหลอนเกิดขึ้นที่จุดใดอย่างแน่ชัด
กระบวนการประเมินของ GraphEval แบ่งออกเป็นสองขั้นตอนหลัก ได้แก่:
- การสร้างกราฟความรู้จากการตอบกลับของโมเดล โดยแปลงข้อมูลเป็นความสัมพันธ์ทางอรรถศาสตร์แบบไตรภาค (Semantic Triples) ในรูปแบบ (ประธาน, ความสัมพันธ์, กรรม) ซึ่งประธานและกรรมคือโหนด (Nodes) และความสัมพันธ์คือเส้นเชื่อม (Edges)
- การประเมินแต่ละไตรภาคเทียบกับบริบทอ้างอิงที่เป็นความจริง (Ground Truth) ผ่านโมเดลการอนุมานภาษาธรรมชาติ (Natural Language Inference - NLI) หากไตรภาคใดขัดแย้งหรือไม่มีข้อมูลสนับสนุนในบริบทอ้างอิง จะถูกระบุว่าเป็นภาวะหลอน
การแสดงตัวอย่าง GraphEval ผ่านโค้ด
ก่อนเริ่มจำลองการใช้งาน GraphEval ตรวจสอบให้แน่ใจว่าได้ติดตั้งไลบรารีที่จำเป็นเรียบร้อยแล้ว:
!pip install -q transformers networkx matplotlib torchในตัวอย่างนี้เราจะทำให้ขั้นตอนการทำงานง่ายขึ้น โดยใช้ฐานข้อมูลความจริงอ้างอิง (Source Context) ที่สมมติขึ้นมา ซึ่งในการใช้งานจริง ข้อมูลนี้อาจมาจากการดึงข้อมูลในระบบ retrieval-augmented generation (RAG)
# The ground-truth context provided to the LLM
source_context = (
    "GraphEval is a hallucination evaluation framework based on representing information "
    "in Knowledge Graph (KG) structures. It acts as a pre-processing step and utilizes "
    "out-of-the-box NLI models to detect factual inconsistencies."
)
สมมติว่า LLM ตอบคำถามว่า "GraphEval คืออะไร" ด้วยข้อมูลที่มีภาวะหลอนปนอยู่ เราจะใช้ Prompt เพื่อสั่งให้โมเดลสกัดข้อมูลออกมาเป็นกราฟความรู้ดังนี้:
# The generated response we want to evaluate (contains a hallucination)
llm_output = (
    "GraphEval is an evaluation framework that uses Knowledge Graphs. "
    "It requires a highly expensive, enterprise-level server farm to operate."
)

# Prompt template that would theoretically be passed to a local/free LLM (e.g. Mistral-7B)
KG_EXTRACTION_PROMPT = f"""
You are an expert information extractor. Extract the core information from the following text as a Knowledge Graph.
Return the output strictly as a Python list of tuples in the format: (Subject, Relationship, Object).

Text: {llm_output}
"""
``` เพื่อลดภาระการประมวลผล เราจะจำลองผลลัพธ์ของไตรภาคที่สกัดได้ ซึ่งมีการจงใจใส่ข้อมูลเท็จเรื่องความต้องการฟาร์มเซิร์ฟเวอร์ระดับองค์กรลงไป เพื่อทดสอบระบบตรวจจับ

```python
# Simulated extraction to bypass the heavy computational load of running a massive LLM locally
extracted_triples = [
    ("GraphEval", "is", "evaluation framework"),
    ("GraphEval", "uses", "Knowledge Graphs"),
    ("GraphEval", "requires", "expensive enterprise server farm")
]

print("Extracted Triples:")
for t in extracted_triples:
    print(t)
ขั้นตอนสุดท้ายคือการใช้โมเดล NLI แบบ Open-source จาก Hugging Face เพื่อตรวจสอบว่าแต่ละไตรภาคสอดคล้องกับความจริงหรือไม่ หากโมเดลไม่ยืนยันความสอดคล้อง (Entailment) ไตรภาคนั้นจะถูกทำเครื่องหมายว่าเป็นภาวะหลอนทันที
from transformers import pipeline

# Loading the open-source NLI model
print("Loading DeBERTa NLI model...")
nli_evaluator = pipeline("text-classification", model="cross-encoder/nli-deberta-v3-small")

def evaluate_triple(context, triple):
    subject, relation, obj = triple
    hypothesis = f"{subject} {relation} {obj}"

# Checking if the context entails the hypothesis
    result = nli_evaluator({"text": context, "text_pair": hypothesis})

# NLI models normally output: 'entailment', 'neutral', or 'contradiction'
    label = result['label'].lower()

# In GraphEval, anything other than 'entailment' is flagged as a hallucination
    is_hallucinated = label != 'entailment'

return is_hallucinated, label, hypothesis

# Running the evaluation pipeline
evaluation_results = []

print("\n--- GraphEval Results ---")
for t in extracted_triples:
    is_hallucinated, nli_label, hypothesis = evaluate_triple(source_context, t)
    evaluation_results.append((is_hallucinated, nli_label))

status = "🚨 HALLUCINATION" if is_hallucinated else "✅ GROUNDED"
    print(f"{status} | Triple: {t} | NLI Output: {nli_label}")
ผลลัพธ์ที่ได้จะแสดงให้เห็นชัดเจนว่าไตรภาคสุดท้ายถูกตรวจพบว่าเป็นภาวะหลอนตามคาด นอกจากนี้เรายังสามารถนำข้อมูลมาสร้างเป็นภาพกราฟเพื่อความเข้าใจที่ง่ายขึ้น โดยใช้สีแดงระบุจุดที่เป็นภาวะหลอนและสีเขียวสำหรับข้อมูลที่ถูกต้อง
import networkx as nx
import matplotlib.pyplot as plt
import matplotlib.patches as mpatches

def visualize_grapheval(triples, eval_results):
    G = nx.DiGraph()
    edge_colors = []

for (triple, res) in zip(triples, eval_results):
        sub, rel, obj = triple
        is_hallucinated = res[0]

G.add_node(sub)
        G.add_node(obj)
        G.add_edge(sub, obj, label=rel)

# Color-code the edges based on the NLI evaluation
        edge_colors.append('red' if is_hallucinated else 'green')

# Set up the plot
    plt.figure(figsize=(10, 6))
    pos = nx.spring_layout(G, seed=42)

# Draw nodes
    nx.draw_networkx_nodes(G, pos, node_color='lightblue', node_size=2500)
    nx.draw_networkx_labels(G, pos, font_size=10, font_weight='bold')

# Draw edges and labels
    nx.draw_networkx_edges(G, pos, edge_color=edge_colors, width=2.5, arrowsize=20)
    edge_labels = nx.get_edge_attributes(G, 'label')
    nx.draw_networkx_edge_labels(G, pos, edge_labels=edge_labels, font_color='black')

# Add legend
    green_patch = mpatches.Patch(color='green', label='Grounded (Entailment)')
    red_patch = mpatches.Patch(color='red', label='Hallucination (Neutral/Contradiction)')
    plt.legend(handles=[green_patch, red_patch], loc='lower right')

plt.title("GraphEval Hallucination Map", fontsize=14, fontweight='bold')
    plt.axis('off')
    plt.tight_layout()
    plt.show()

# Render the knowledge graph
visualize_grapheval(extracted_triples, evaluation_results)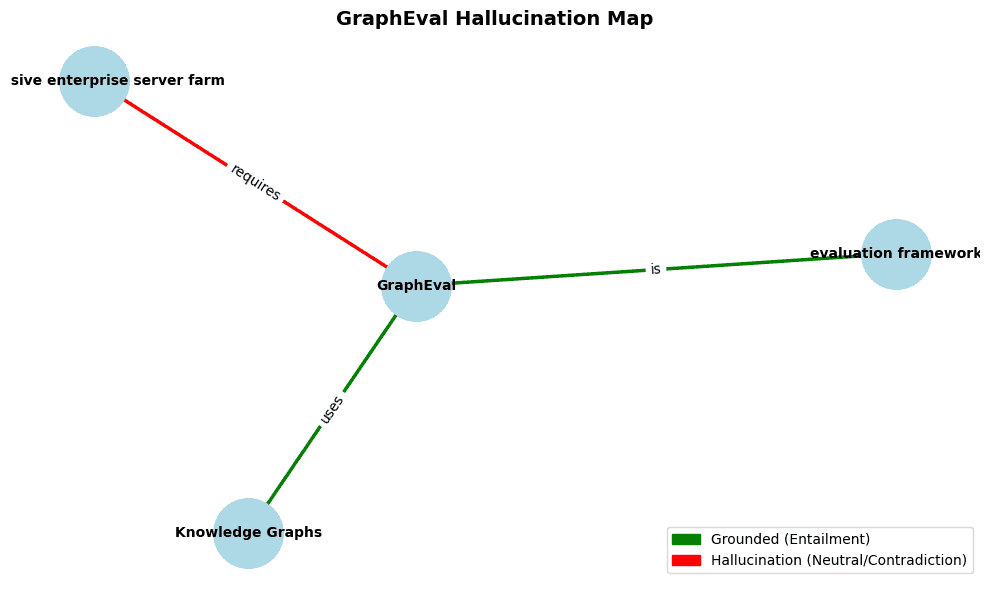
บทสรุป
GraphEval เป็นระเบียบวิธีการประเมินที่มีประสิทธิภาพในการตรวจจับและระบุต้นเหตุของภาวะหลอนในการตอบกลับของ LLM การเปลี่ยนหลักการเชิงทฤษฎีให้กลายเป็นสถานการณ์จำลองเชิงปฏิบัติ จะช่วยให้เหล่านักพัฒนาเข้าใจถึงความสำคัญและนำไปปรับใช้ในระบบการผลิต (Production) ได้อย่างมีประสิทธิภาพมากขึ้น
ความคิดเห็น (0)
เข้าสู่ระบบเพื่อร่วมแสดงความเห็น
สมัครสมาชิกมาเป็นคนแรกที่แสดงความเห็นกันเลยโบร